
The end of the year provides a natural opportunity to look back and reflect on what we learned over the last 12 months as investors. I very much enjoyed thinking about how to tell the story of this market in just five charts, and to be completely honest, the videos below include way more than that!

But as much we love to make things more complicated for ourselves, mindful investors know that simple is often the best approach. So, by boiling down this year into five major themes and using these charts as a starting point to a deeper analysis of each, I found it to be a rewarding and at times eye-opening experience.
You can access the full playlist of the Top Five Charts on our YouTube channel, and you are welcome to ChartList I used during the videos, which you can find right HERE!
Without further ado, here are the five charts I selected, along with descriptions and video links. I hope you can use these as inspiration for your own year-end process and performance review!
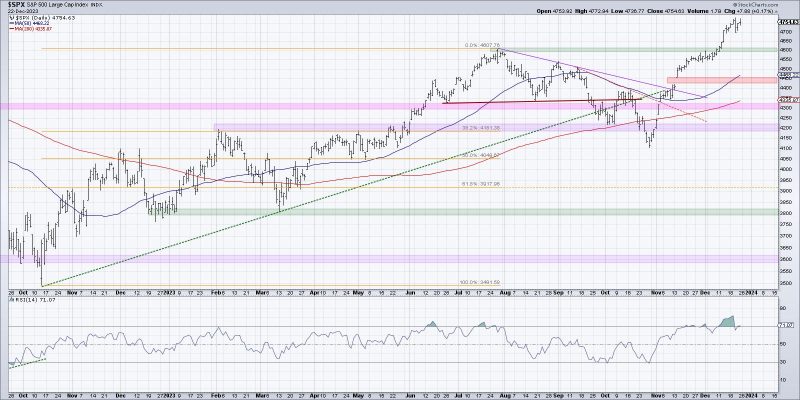
Chart #1: S&P 500
As Ralph Acampora told me years ago, “Always start with a simple chart of the S&P 500.” And it’s been a fascinating year to do so, with each quarter providing a unique experience for investors, including plenty of ups and downs.
Looking back, I’m struck by what a sideways market we experienced really through the end of May. The S&P started with a strong January, but subsequent months basically brought retests of previous highs and previous lows, and no real indication of bullishness or bearishness on the larger timeframe.
June’s breakout provided a perfect example of the bearish momentum divergence, as negative momentum into the July high indicated an exhaustion of buyers. I also find myself focusing in on the October low, which caused me to be quite bearish at the time. That was definitely one of my key lessons learned in 2023, especially the importance of recognizing a clear change of character in November.
Chart #2: Ten Year Treasury Yield
Back in January 2023, I was asked during an interview to identify the most important chart to watch in 2023. I answered this chart, the Ten Year Treasury Yield ($TNX), along with the value vs. growth ratio. My thesis was that many investors had not experienced a rising rate environment (including me!), so this could mean some painful lessons as value outperformed growth as interest rates pushed higher.
As the chart clearly shows, the Ten Year Yield going from around 4% to 5%, completing a long journey from almost zero rates not long ago, did not provide the tailwind for value stocks that I expected. What a beautiful testament to the benefits of including macroeconomic analysis as part of a holistic investment approach, but also the importance of focusing on the evidence of price itself. If the charts say growth is outperforming, I’m going to want to stick with growth until proven otherwise.
Chart #3: Market Breadth
Breadth analysis is an essential component to my analytical process, as it addresses the issues related to our growth-oriented benchmarks being dominated by a small number of mega-cap stocks.
This chart includes three different breadth indicators: the S&P 500 Bullish Percent Index, the Percent of Stocks Above the 50-day Moving Average, and the McClellan Oscillator. With the first two indicators at 80% and 90%, respectively, this suggests a potential exhaustion point to the current upswing, similar to what we observed in July 2023, November 2022, and August 2022.
Chart #4: Leadership Themes
I have been thinking of 2023 as the year of mega-cap growth, but this fourth chart that it actually wasn’t about growth over value, but rather large over small. Reviewing the nine Morningstar style boxes, it’s clear that, while growth did indeed outperform value, it was overall more of large vs. small story.
Large-cap growth has outperformed large-cap value by almost 900 basis points (nine percent), but has outperformed mid-cap and small-cap style boxes by around 1300 basis points. Our benchmarks have been powering higher, propelled by the strength of large-cap growth, and one of the most important questions for 2024 will be whether this stretch of domination will continue.
Chart #5: Bitcoin
Higher highs and higher lows make an uptrend. And while Bitcoin ($BTCUSD) did not show that general pattern in the middle of 2023, it started the year strong and certainly ended the year in a position of strength.
Bitcoin has nearly tripled in value since December 2022, starting with a significant rally into an April high. But from March through October, Bitcoin basically was rangebound between 25,000 and 31,000. I remember laying out a game plan, which involved following the price momentum fueling any exit from that range. Sure enough, in October, we witnessed an upside breakout inspired by renewed optimism for a potential announcement confirming new spot Bitcoin ETFs. While that news has not yet arrived, the bullish uptrend shows that investors remain eager for this huge potential catalyst.
During my years in the Fidelity Chart Room, I was often reminded that charts can tell the best stories about market history. And as each new year concludes, the charts can provide a fantastic report card for your performance, a history textbook filled with practical lessons for years to come, and a reminder of the value of technical analysis in helping us identify opportunities and manage risk.
I hope these discussions inspire you to have a thorough review session as we wrap 2023, and an honest assessment of how you can improve your investing toolkit in 2024.
Happy holidays, thank you for making StockCharts a part of your process, and I’ll look forward to more great charts and conversations in the new year!
RR#6,
Dave
P.S. Ready to upgrade your investment process? Check out my free behavioral investing course!
David Keller, CMT
Chief Market Strategist
StockCharts.com
Disclaimer: This blog is for educational purposes only and should not be construed as financial advice. The ideas and strategies should never be used without first assessing your own personal and financial situation, or without consulting a financial professional.
The author does not have a position in mentioned securities at the time of publication. Any opinions expressed herein are solely those of the author and do not in any way represent the views or opinions of any other person or entity.


