
Even though the iShares Semiconductor ETF (SMH) and the VanEck Semiconductor ETF (SOXX) have many similarities, there are some big differences in their component weightings and performance. Namely, SMH allows more concentration than SOXX and SMH is holding up better than SOXX. SOXX already broke down on the price chart and SMH is at a critical juncture as its biggest component reports earnings this week.
SOXX) and SMH are the two largest semiconductor ETFs by AUM (assets under management). However, as I learned from this video at nAnalyze, their weighing rules are very different. In particular, SOXX caps the weighting of the top five stocks at 8% each and rebalances. SMH, on the other hand, caps the weight of the top three at 20% each and then rebalances. This higher threshold allows more room for a momentum run. It is little surprise that the top three holdings in SMH are Nvidia (23.66%), Taiwan Semiconductor (13.2%) and Broadcom (7.71%). The top three holding for SOXX are Nvidia (10.12%), Broadcom (8.77%) and Advanced Micro Devices (8%).
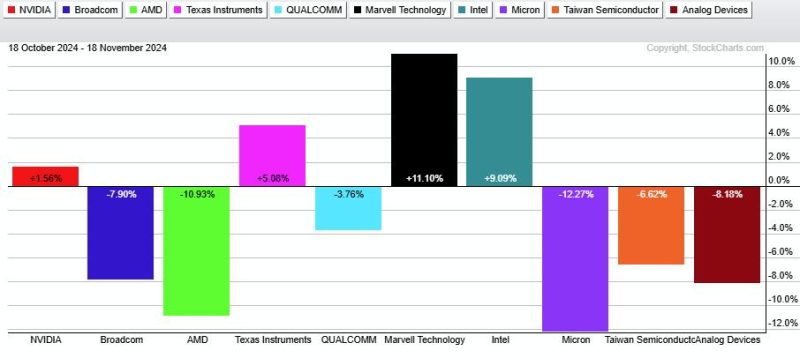
The PerfChart below shows the one-month percentage change for ten semiconductor stocks. It is a mixed bag with four up and six down. Nvidia (red bar) is up 1.5%, two are down double digits (AMD and Micron) and only one is up double digits (Marvell). Short-term, it has been a rough ride for the group.
The next chart shows SOXX breaking wedge support and its 200-day SMA with a sharp decline on October 31st. SOXX rebounded back into the wedge with a three-day election bounce and then fell below its late October low. This means the wedge break is in play with the first target zone in the 195 area. A close above 235 would call for a re-evaluation. The indicator window shows relative performance using the SOXX/RSP ratio (SOXX divided by the S&P 500 EW ETF (RSP)). This ratio has been below its 200-day SMA since late August, which means SOXX has been underperforming for around three months.

What is the significance of a rising wedge? A rising wedge is a bearish continuation pattern that marks a counter-trend bounce after a trend-changing decline. SOXX fell around 25% from mid July to early August and then retraced around 61.8% with the rising wedge to 240. Both the pattern and the retracement amount are typical for counter-trend bounces. The wedge break in October reversed the medium-term uptrend and signaled a continuation of the July-August decline. A 25% decline from the wedge high would target a move to the 180 area.
Click here to learn more about TrendInvestorPro and get two bonus reports!
The next chart shows SMH with a rising wedge, but the ETF has yet to break the October low (235) or the 200-day SMA. SMH did break the lower line of the wedge with a decline last week. Also notice that SMH is trading below the level it was trading at before the election. SMH is at a make or break level with Nvidia (NVDA) set to report earnings on Wednesday after the close. SMH stays bullish as long as 235 holds. A break would confirm the wedge and target a move to the 200 area.
Stay on the right side of the trend with our weekly reports and videos. Our robust top-down approach started with broad market analysis to set the overall tone. We then drill to down to find ETFs and stocks with bullish setups within long-term uptrends.
Highlights from Recent Weekly Reports/Videos:
- S&P 500 breadth remains strong and Nasdaq 100 breadth remains strong enough, but Nasdaq 100 is lagging because a third of its stocks are in long-term downtrends.
- Fintech, Cybersecurity, Software and Cloud Computer ETFs were leading before the election surge and became very extended with the election surge. Time for some patience.
- The Gold ETF became oversold for the first time this year.
- Copper, Base Metals and Copper Miners failed hold their breakouts as they got hit post election.
- The 10-yr Treasury Yield is on the rise as TLT moves sharply lower. What is the market telling us?
Click here to learn more and get two bonus reports!
///////////////////////////////////


