
In a truncated trading week, the Indian equities closed the week with gains thanks to a robust technical rebound that it witnessed on Friday. The Nifty continued to wear a corrective look for three days; on the last trading day of the week, the Index managed to get itself into positive territory at close. Had it not been for the technical rebound on Friday, the Index would have been heading to yet another negative weekly close. The trading range stayed wider on the anticipated lines, and the Nifty oscillated in the 692.95 points range over the past four trading sessions. The volatility edged higher; the IndiaVIX surged and closed 8.95% higher at 16.10 on a weekly basis. The headline index closed with a net weekly gain of 374.55 points (+1.59%).
The markets saw some important technical levels getting tested. The Nifty tested and violated the 200-DMA, presently placed at 23593. It also tested the 50-week MA, which is currently at 23312. Thanks to the rebound seen on Friday, the Nifty managed to rebound from these levels and close above the 200-DMA. However, the Nifty is testing the crucial pattern resistance levels and is not entirely out of the woods yet. We also enter the expiry week of the monthly derivative series; the coming days will likely remain influenced by rollover-centric activities. In any case, 23500-23300 is a crucial support zone for the Index; as long as this zone stays defended, we are unlikely to see any further downside. However, if this zone gets violated, we will be in for an extended corrective period.
We are likely to see a stable start for the coming week. The levels of 24150 and 24300 shall act as resistance levels. Supports are likely to come in at 23650 and 23500 levels.
The weekly RSI stands at 47.59; it remains neutral and does not show any divergence against the price. The weekly MACD is bearish and trades below the signal line. The PPO is negative.
The weekly chart pattern analysis indicates that the Nifty is supported by an extended trendline, which aligns with the 50-week moving average currently at 23312. This level is a crucial support for the Nifty, and a breach of this point would weaken the markets further.
Despite a robust technical rebound after testing the 50-week MA, the Nifty is not yet out of the woods. The Nifty will have to defend the 23300 on a closing basis; it will also need to cross above the 24150-24300 to confirm a base formation at the current lows. Market participants need to guard their profits at higher levels. A cautious outlook is advised for the week; keep leveraged exposure at modest levels.
Sector Analysis for the Coming Week
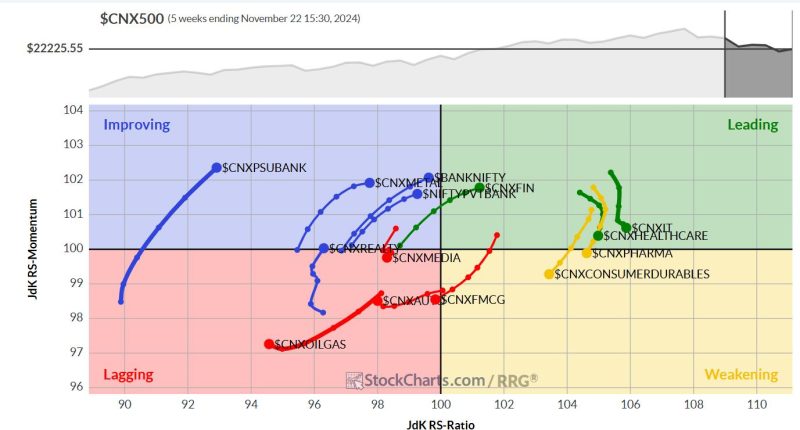
In our look at Relative Rotation Graphs®, we compared various sectors against CNX500 (NIFTY 500 Index), which represents over 95% of the free float market cap of all the stocks listed.
Relative Rotation Graphs (RRG) show a lack of leadership as only Nifty IT, Financial Services, and Services Sector indices are inside the leading quadrant. However, these groups are expected to outperform the broader markets relatively.

The Nifty Pharma Index has rolled inside the weakening quadrant. The Nifty Midcap 100 and Consumption Index are also inside the weakening quadrant.
The FMCG Index has rolled inside the weakening quadrant. The Nifty Auto, Energy, Commodities, PSE, Infrastructure, and Media Indices are inside the weakening quadrant and may relatively underperform the broader markets. However, the PSE and the Infrastructure indices are improving relative momentum against the broader Nifty 500 index.
The Nifty Realty Index has rolled inside the improving quadrant, potentially signaling the onset of a phase of relative outperformance. The Metal, Nifty, Bank, and PSU indices are also in the improving quadrant.
Important Note: RRG charts show the relative strength and momentum of a group of stocks. In the above chart, they show relative performance against NIFTY500 Index (Broader Markets) and should not be used directly as buy or sell signals.
Milan Vaishnav, CMT, MSTA
Consulting Technical Analyst
www.EquityResearch.asia | www.ChartWizard.ae


