
The markets had an incredibly eventful week as they reacted to the exit polls and general election results. All happened in the same week; the Nifty saw itself formin a fresh lifetime high and also came off close to 8% from its peak. A remarkable recovery also followed that led Nifty to a fresh closing high as well. The trading range also remained extremely wide; the Nifty oscillated in a massive 2057.25 points range before closing near its high. The volatility too swung violently. It surged over 40% at one point in time; by the end of the week, it came off by 31.38% to 16.88 as compared to its previous week’s close. Following such a kind of move, the headline index Nifty 50 finally settled with a net weekly gain of 759.45 points (+3.37%).
As we step into the next week, the markets may also show some more extension of the pullback. At the same time, at this juncture, the markets also look vulnerable to profit-taking-led retracements from current or higher levels as well. The more important concern is that of market breadth. The breadth of the broader market is not as strong as it should be; while the broader market index Nifty 500 is inching higher, the breadth is not seen keeping pace with the kind of strength that it should. Furthermore, despite the kind of volatility that the markets have seen, they have played out within the pattern resistance and support levels. Currently, the Nifty has closed just below a pattern resistance level.
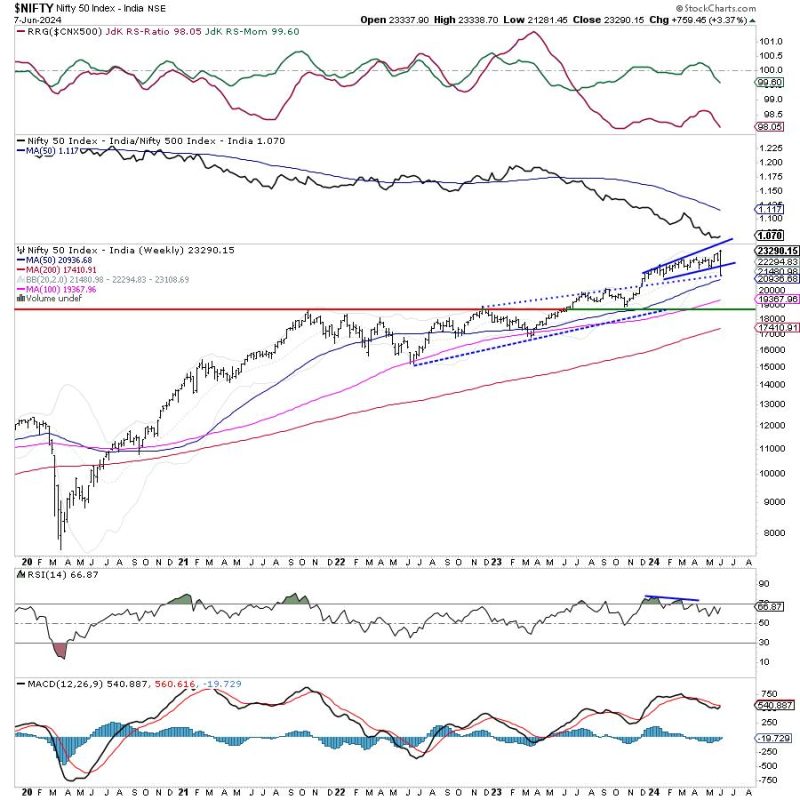
The coming week may see the markets opening on a quiet note. The levels of 23400 and 23550 are likely to act as probable resistance levels. The supports come in at 22900 and 22630 levels.
The weekly RSI is 66.87; it shows a bearish divergence against the price. While the price has closed at a new high, the RSI has not. This has led to the emergence of the RSI’s bearish divergence. The weekly MACD stays bearish and below the signal line. A long-legged Doji is seen on Candles. Doji’s are more potent than spinning tops; their occurrence near the high point has the potential to disrupt any ongoing rally.

The pattern analysis of the weekly charts shows that the negative spike that the markets witnessed found support at the rising trendline of the channel that it had broken out from; and on the upside during the rebound, the Nifty has closed just below the upper rising trend line of the small channel that it has formed. The lead indicators continue to show negative divergence and the breadth remains not as strong as it should be. All this continues to leave the markets vulnerable to profit-taking at higher levels.
All in all, the Nifty has seen a strong rebound from lower levels post its extremely negative reaction to the general election outcome. This pullback may get extended a bit more but now the markets stare at some imminent profit-taking from higher levels. The markets are also seeing defensive setups play out the defensive pockets like FMCG and Pharma have started to do well. It is recommended to now use the moves to protect profits at higher levels. Leveraged exposures should be pared and fresh buying should be focused on defensive pockets and the stocks with improving relative strength. A cautious outlook is advised for the coming week.
Sector Analysis for the coming week
In our look at Relative Rotation Graphs®, we compared various sectors against CNX500 (NIFTY 500 Index), which represents over 95% of the free float market cap of all the stocks listed.
Relative Rotation Graphs (RRG) show that the Nifty Auto, Consumption, and Metal Index continue to stay inside the leading quadrant. Besides this, the Nifty Midcap 100 has also rolled inside the leading quadrant. This means that the broader market space may relatively outperform the frontline indices.
The Nifty Energy, Commodities, PSE, PSU Banks, Pharma, and Infrastructure indices are inside the weakening quadrant. The Nifty Realty Index is also inside the weakening quadrant but it is seen improving on its relative momentum against the broader markets.
The Nifty Services sector has rolled inside the lagging quadrant. Besides this, the IT index is also inside the lagging quadrant; however, that is seen improving on its relative momentum against the broader Nifty 500 index.
Nifty Bank, Financial Services, FMCG, and the Media Indices are inside the improving quadrant of the RRG. Among these, the Financial Services and Nifty Bank indices are seen paring their relative momentum against the broader markets.
Important Note: RRG charts show the relative strength and momentum of a group of stocks. In the above Chart, they show relative performance against NIFTY500 Index (Broader Markets) and should not be used directly as buy or sell signals.
Milan Vaishnav, CMT, MSTA
Consulting Technical Analyst
www.EquityResearch.asia | www.ChartWizard.ae


